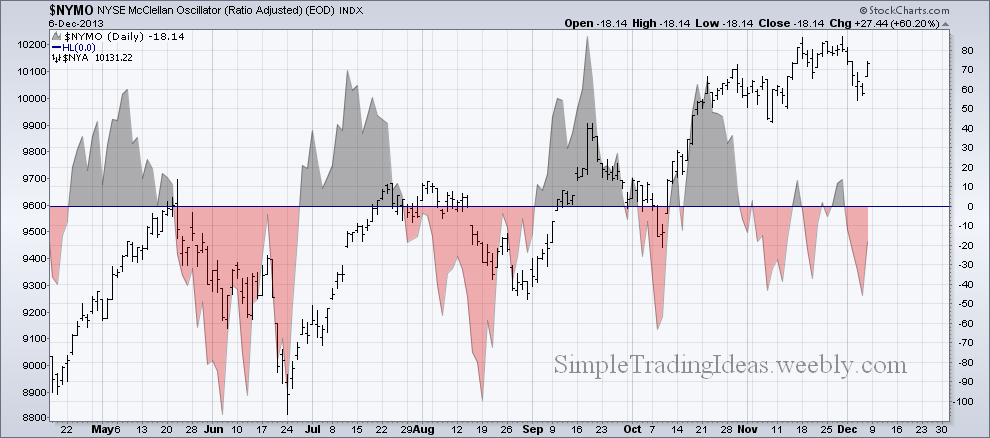
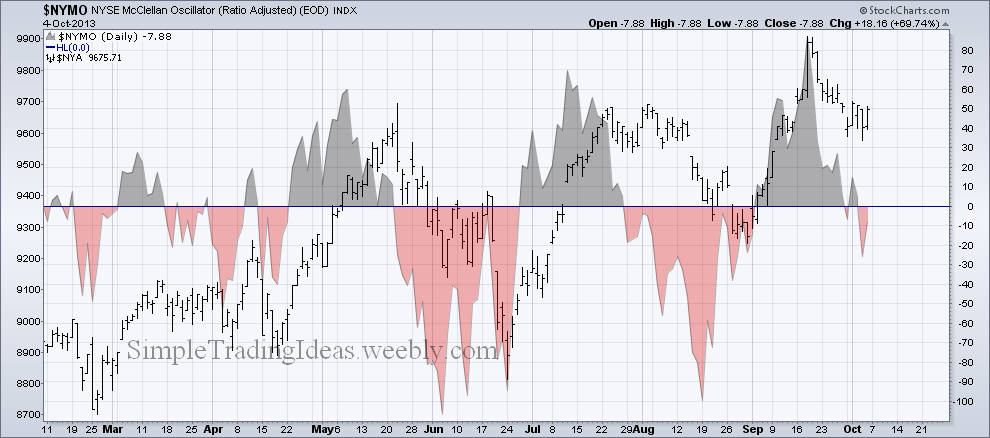
$NYMO, the NYSE McClellan oscillator turned negative in November and stayed negative for the most part. It turned positive twice since then but stayed below 50 even though $NYA moved higher. Since the McClellan oscillator is a breadth indicator calculated from net advances, staying below zero means that declining issues outnumber advancing issues.
0 Comments
$SPXA50R shows the percent of S&P 500 stocks above their 50-day moving average. The chart below shows $SPXA50R with the 5-day and 20-day EMAs. The shorter term EMA crossed below the longer term EMA. There is $SPX, the S&P 500 index in the background. The indicator shows the correlation between $SPXA50R and $SPX which is most of the time close to 1. It means high correlation.
$NYAD is showing the net advances on the New York Stock exchange which is the advancing issues less the declining issues. It is a breadth indicator. The chart below shows only the 21-day and 50-day moving averages to smooth the data. The horizontal lines represent overbought and oversold areas. Below the chart $NYA the NYSE composite index is shown. When $NYAD declines it is ashort-term bearish developement.
The chart below shows that $NYA, the NYSA Composite Index is moving higher and $NYMO, the NYSE McClellan Oscillator is moving lower. This looks like a bearish developement. There was a similar bearish divergence back in May and July as you can also see on the chart.
The chart below shows that $NYA, the NYSE Composite Index advanced but not $NYAD, the NYSE Advance-Decline Line. The declining issues exceeded the advancing issues. Normally they move in the same direction. Also notice that the 10-day EMA is reaching extreme highs.
$TRIN is the New York Stock Exchange short-term Trading Arms Index. It is a breadth indicator and is calculated from the AD ratio divided by the AD Volume ratio:
(advances / declines) / (up volume / down volume) Low readings, below 1 show relative strength and high readings, above 1 show relative weakness. $TRIN can be used to detect overbought/oversold conditions. The chart below shows $TRIN. Notice how it dipped below 0.5 which is considered overbought. $NYMO, the New York Stock Exchange McClellan Oscillator is in negative territory which is bearish. $NYMO is a breadth indicator and is calculated from Net Advances on the NYSE. When $NYMO is negative declining issues are dominating. $NYMO works similar to MACD it puts momentum into the Advance-Decline Line.
$SPXA150R is the S&P 500 Percent of stocks above their 150-day moving average. $SPXA150R is a breadth indicator. The chart below shows the 5-day and 20-day EMA with $SPX in the background for comparison. There is a noticeable divergence between the two charts. $SPXA150R started to decline before $SPX. This is a bearish divergence which could be a sign of a medium term trend change.
The chart below shows the declining volume relative to the total volume on the New York Stick Exchange with the 20-day and 50-day EMAs. Both moving averages are above 0.50 which means that more than 50% is the volume is declining. The actual number for Friday was 0.71. The background shows $SPX but $NYA the NYSE Composite Index would be similar.
Less than 40 percent of the S&P 500 stocks are above their 50-day moving average. Even the 5-day EMA is below 40. The chart below shows the 5-day and 20-day EMA for $SPXA50R with $SPX in the background.
|
Loading
Search Site
Links
Archives
September 2014
Categories
All
|